00
NY State Park app is an app that reconnects families
through daily small & simple interactions.
Timeline
In Progress (Feb 2024 - Present)
My Role
Web App & Website UX/UI Design
Design & Visual Systems
Branding
Visual Design
Infographic Design
For
New York State
With
Chiwon Lee (Design Lead)
Lauren Choi (Product Designer)
Tools
Figma
Summary
We are currently progressing with the project, having returned from the ideation stage. We are now conducting user surveys, A/B testing using eye-tracking technology, and semi-structured user interviews. The process outlined below reflects the completed stages so far. As the project advances, we will continuously update the case study accordingly.
Problem statment
project background
Park plays a huge role in human's mental health as 40% is more depressed if they are not visited as frequent as possible
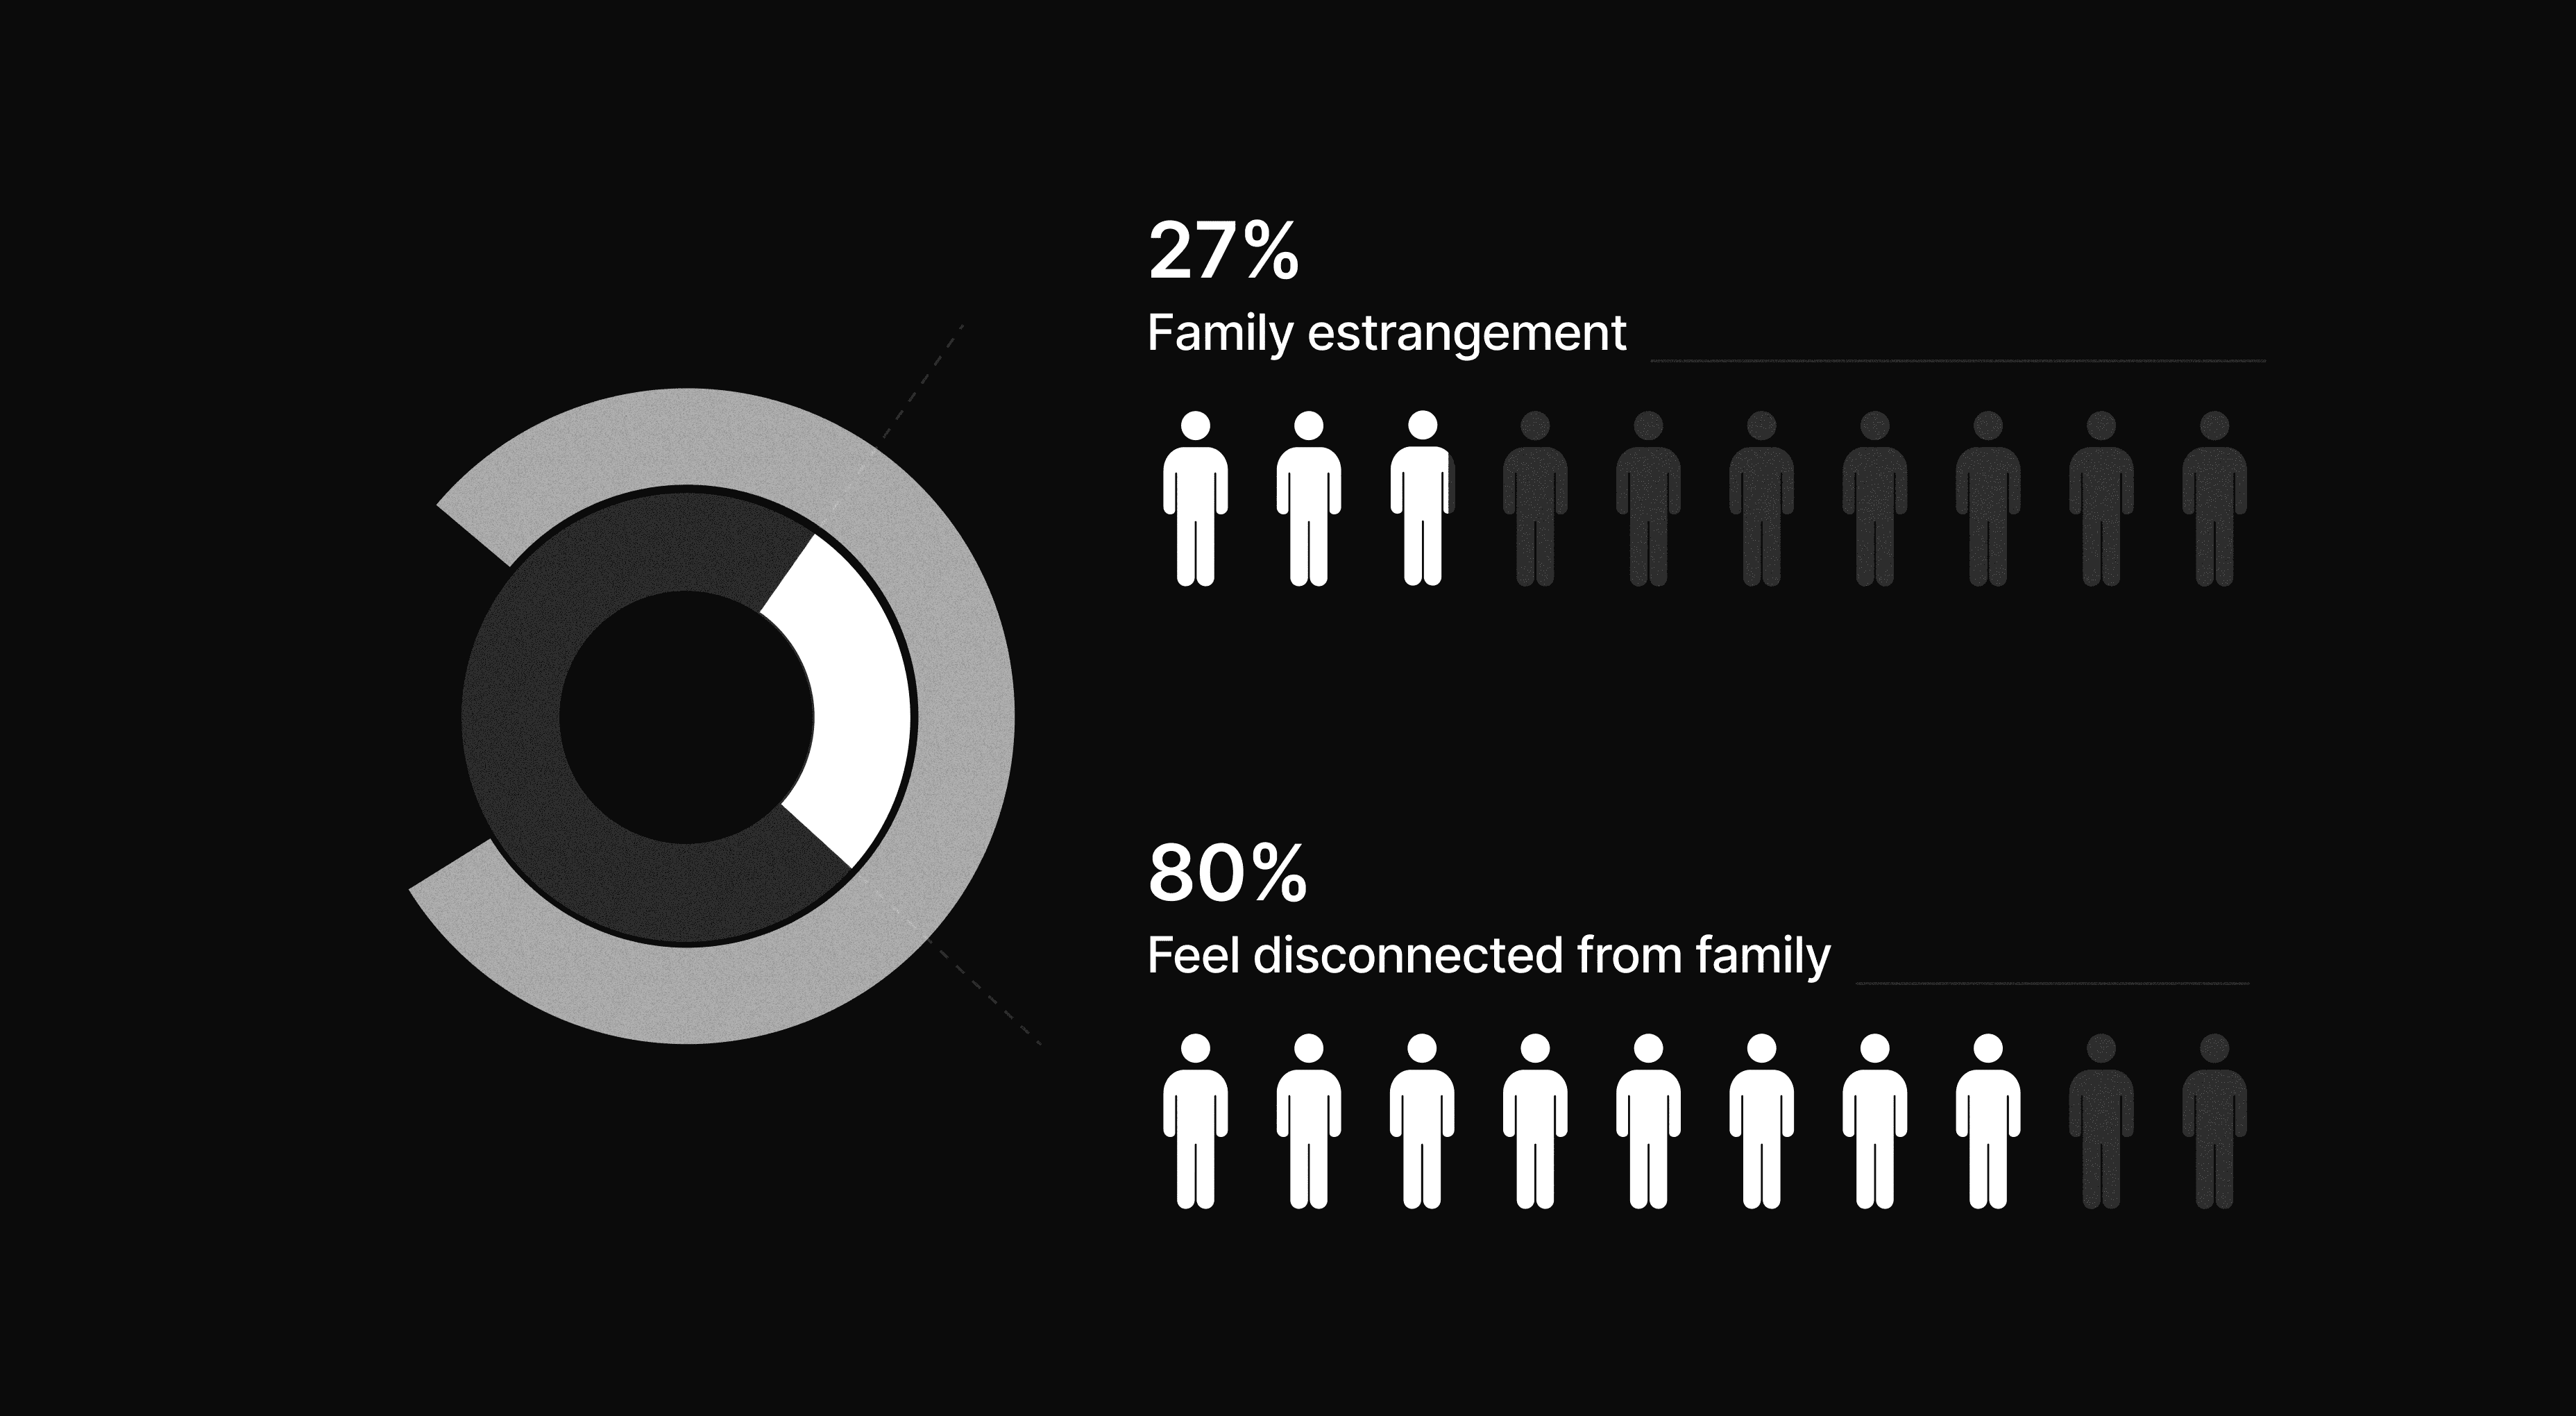
Estrangement occurs when family members grow apart and lose touch with one another. 70 million, which is 27% of Americans, are currently in an estrangement. Furthermore, at least 80% of people have felt disconnected from their family in their daily lives.
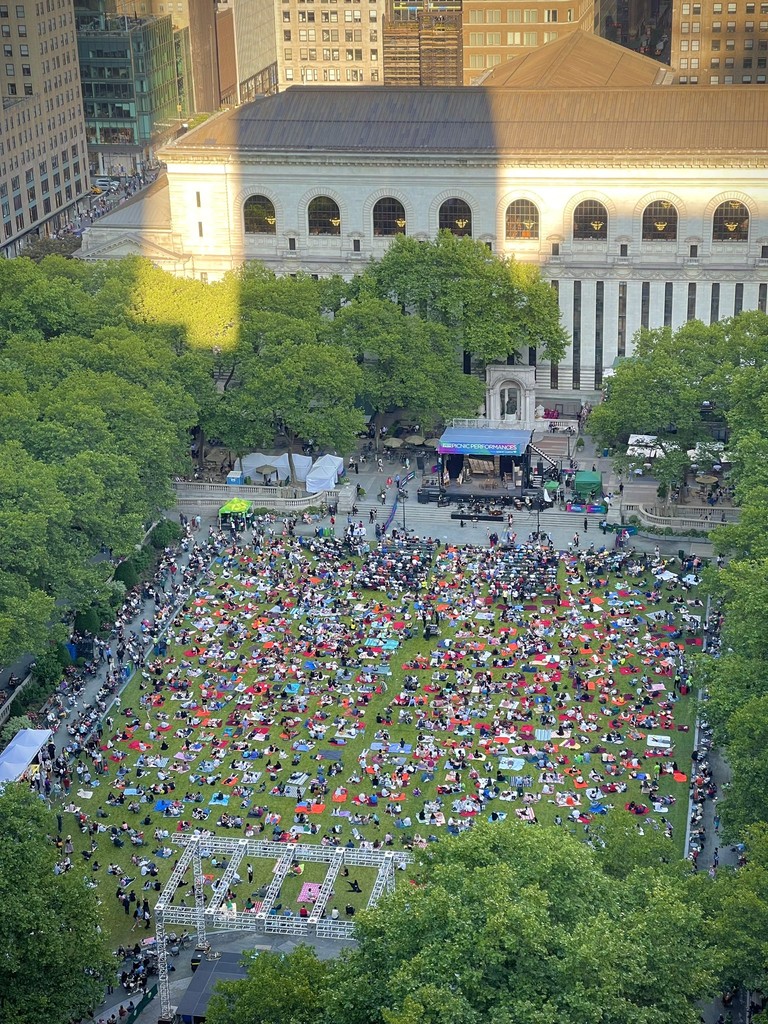
And especially for NewYorkers who lives in one of the most crowded and busiest city in the world.
user interview
But...This is what we usually see in NY well-knowned parks in the weekend.
Following the secondary research and user survey phase, I interviewed three U.S. residents: a 21-year-old college student navigating parental divorce, a 29-year-old software engineer who has been on his own in the U.S. from a young age, and a 51-year-old mother managing a long-distance relationship with her daughter who lives in another state.

problem statement
How might we help estranged or disconnected families build positive interactions through simple and consistent actions so that they can slowly rekindle their relationships over time?
Problem statment
01
Solutions.
How did we identify actionable user pain points from our research insights?
project goal 🚀
Ensure families stay connected through regular, small positive interactions every day.
Let’s take a look solution we made.
Meet Buddy
key feature 1
Over 80% of people in the USA often feel disconnected from their families
Estrangement occurs when family members grow apart and lose touch with one another. 70 million, which is 27% of Americans, are currently in an estrangement. Furthermore, at least 80% of people have felt disconnected from their family in their daily lives.


Family questionnaire
Tailored quests & chapter
02
Research.
How did we identify actionable user pain points from our research insights?
project background
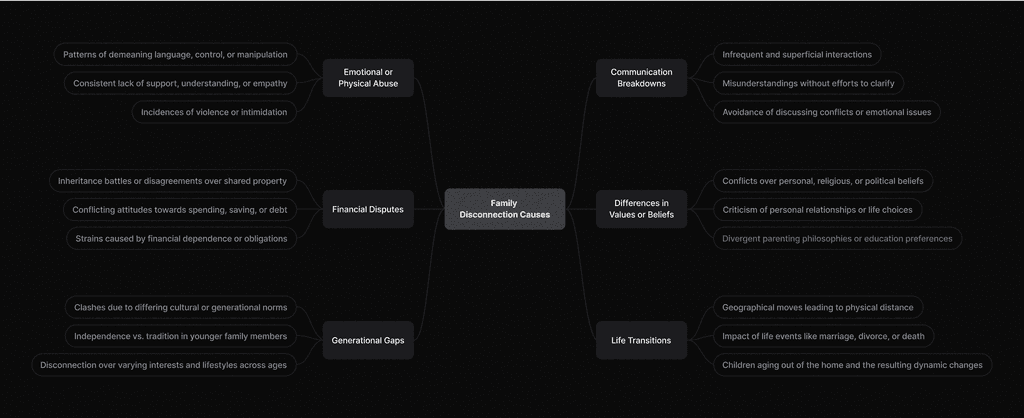
Understanding various negative interactions which cause family disconnection
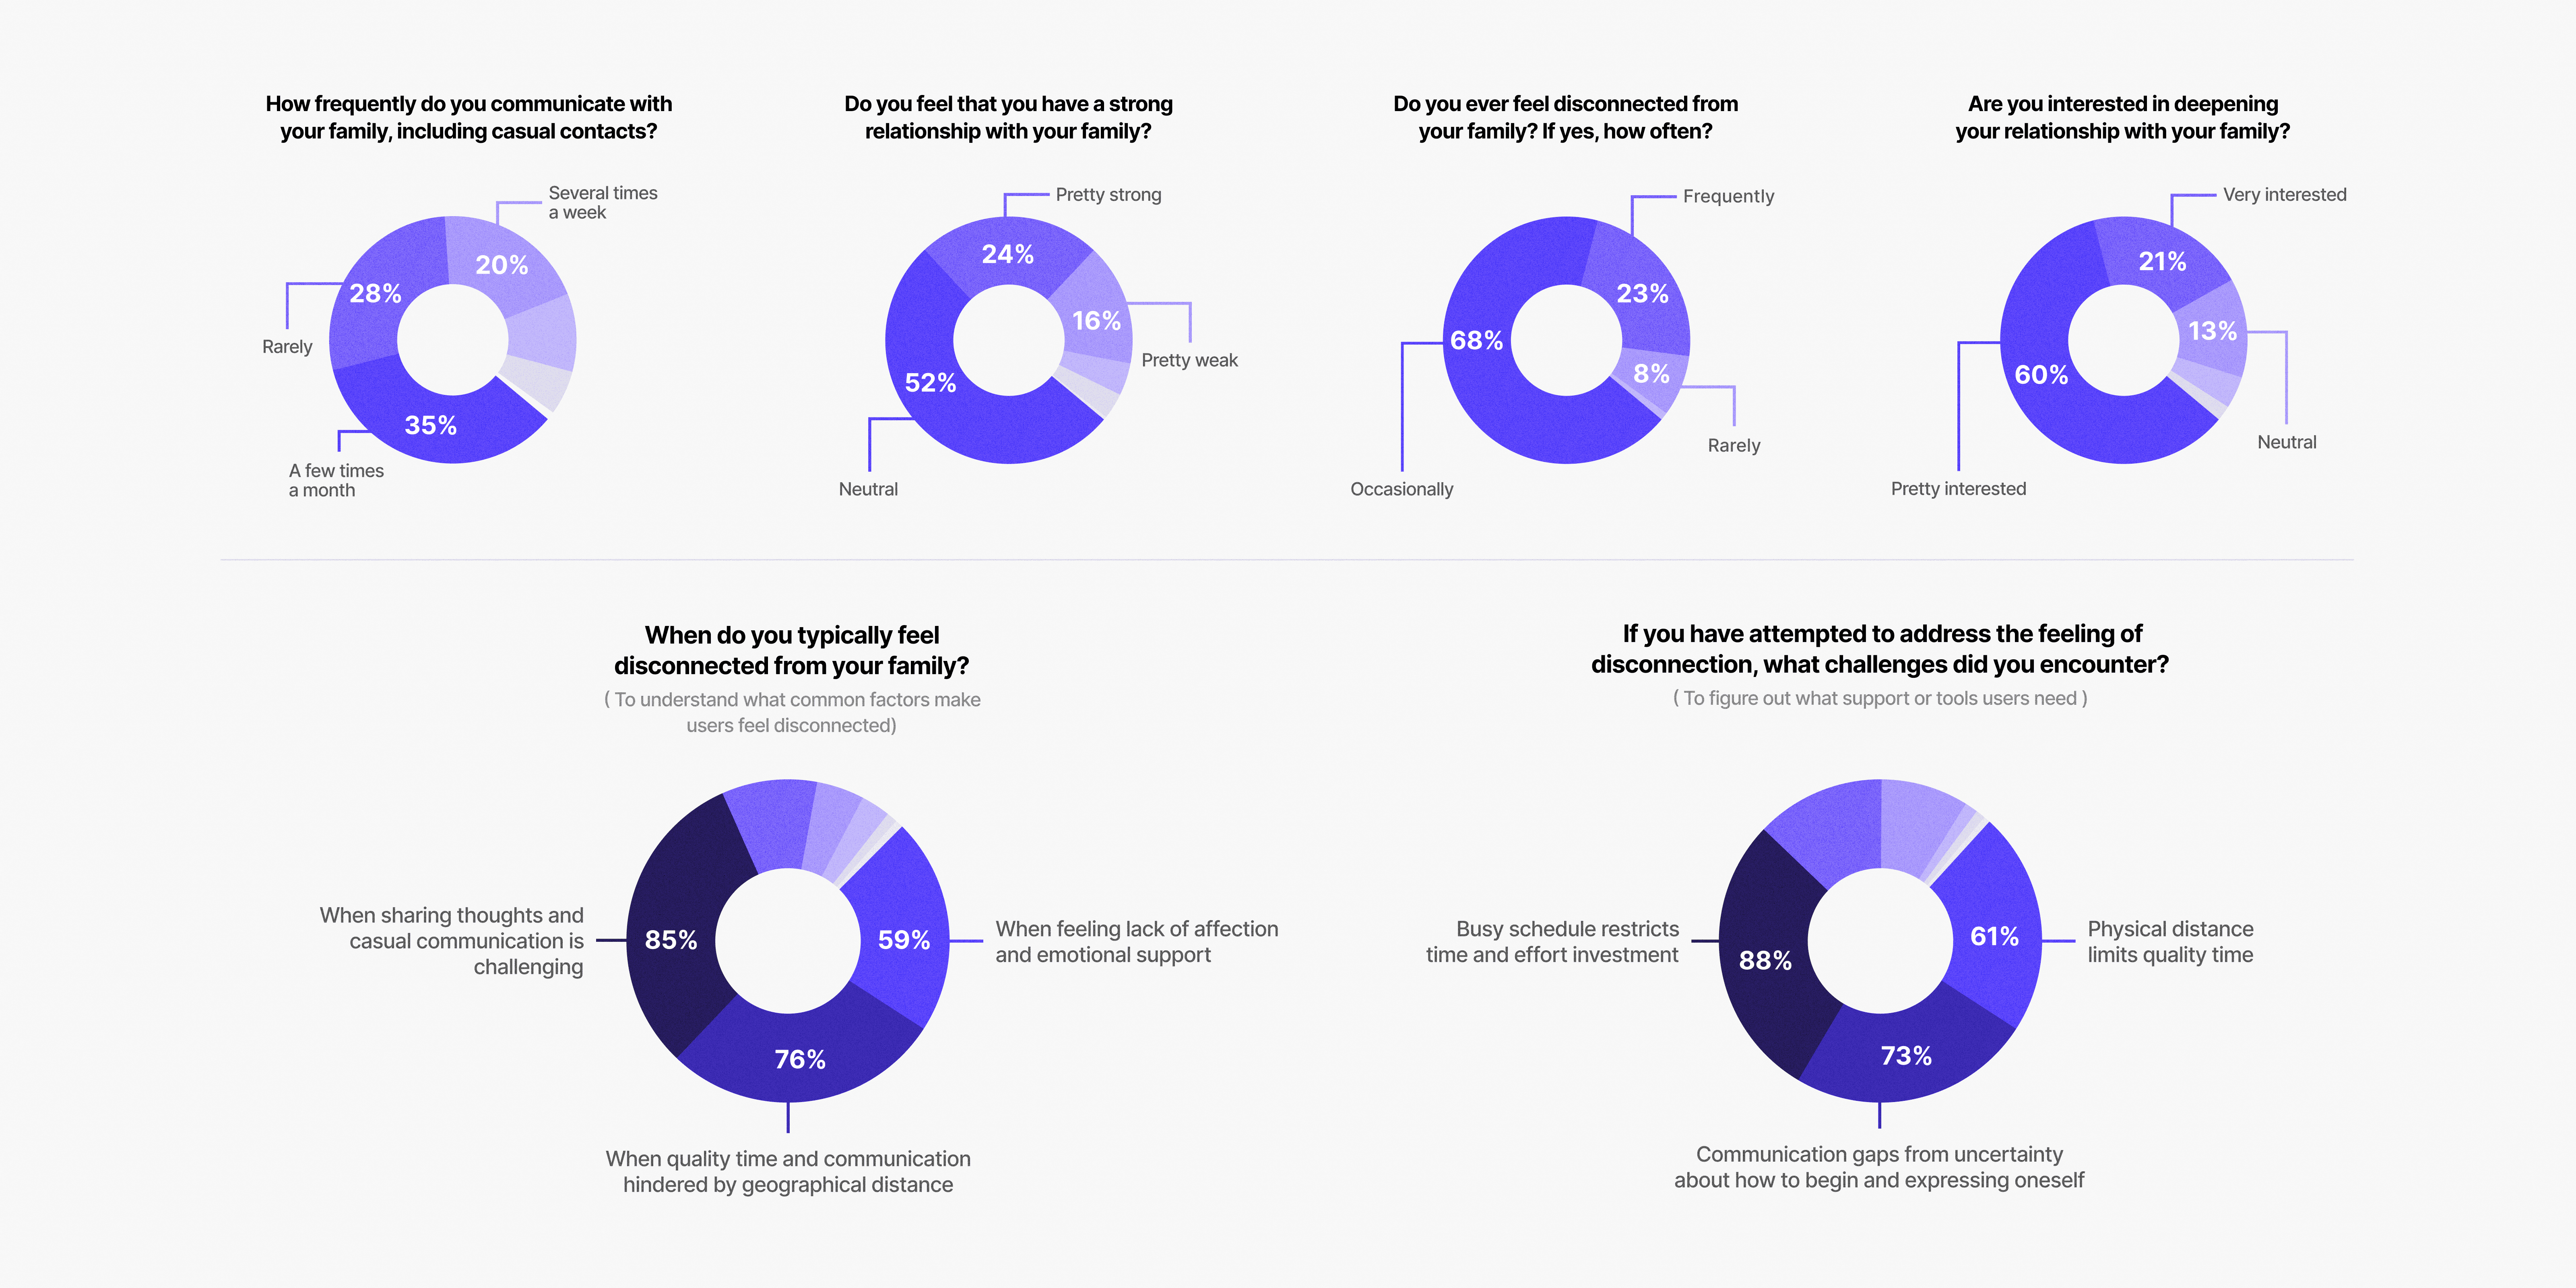
The survey received 50 responses from participants in the US, UK and South Korea, aged between 18 and 51 years. The results of the survey allowed me to target specific issues related to family disconnection. For instance, I found that while people hoped to bond the family relationship, the majority of participants were not used to contact with their family.
user interview
Conducted survey for 52 people to define the daily life problem
Following the secondary research and user survey phase, I interviewed three U.S. residents: a 21-year-old college student navigating parental divorce, a 29-year-old software engineer who has been on his own in the U.S. from a young age, and a 51-year-old mother managing a long-distance relationship with her daughter who lives in another state.
Problem context
Main pain points.
01
Physical Distance or busy schedule Hinder Quality Time
Long distances and busy schedules complicate the ability to regularly schedule quality time together.
02
Misunderstood Burden
of Communication
Misconceptions that communication must always be deep and serious make users fearful and burdened.
03
Uncertainty on How to Improve Family Relationships
The user's struggle with not knowing the steps to take to reconnect or strengthen ties with family members.
02
Ideation.
How did we identify actionable user pain points from our research insights?
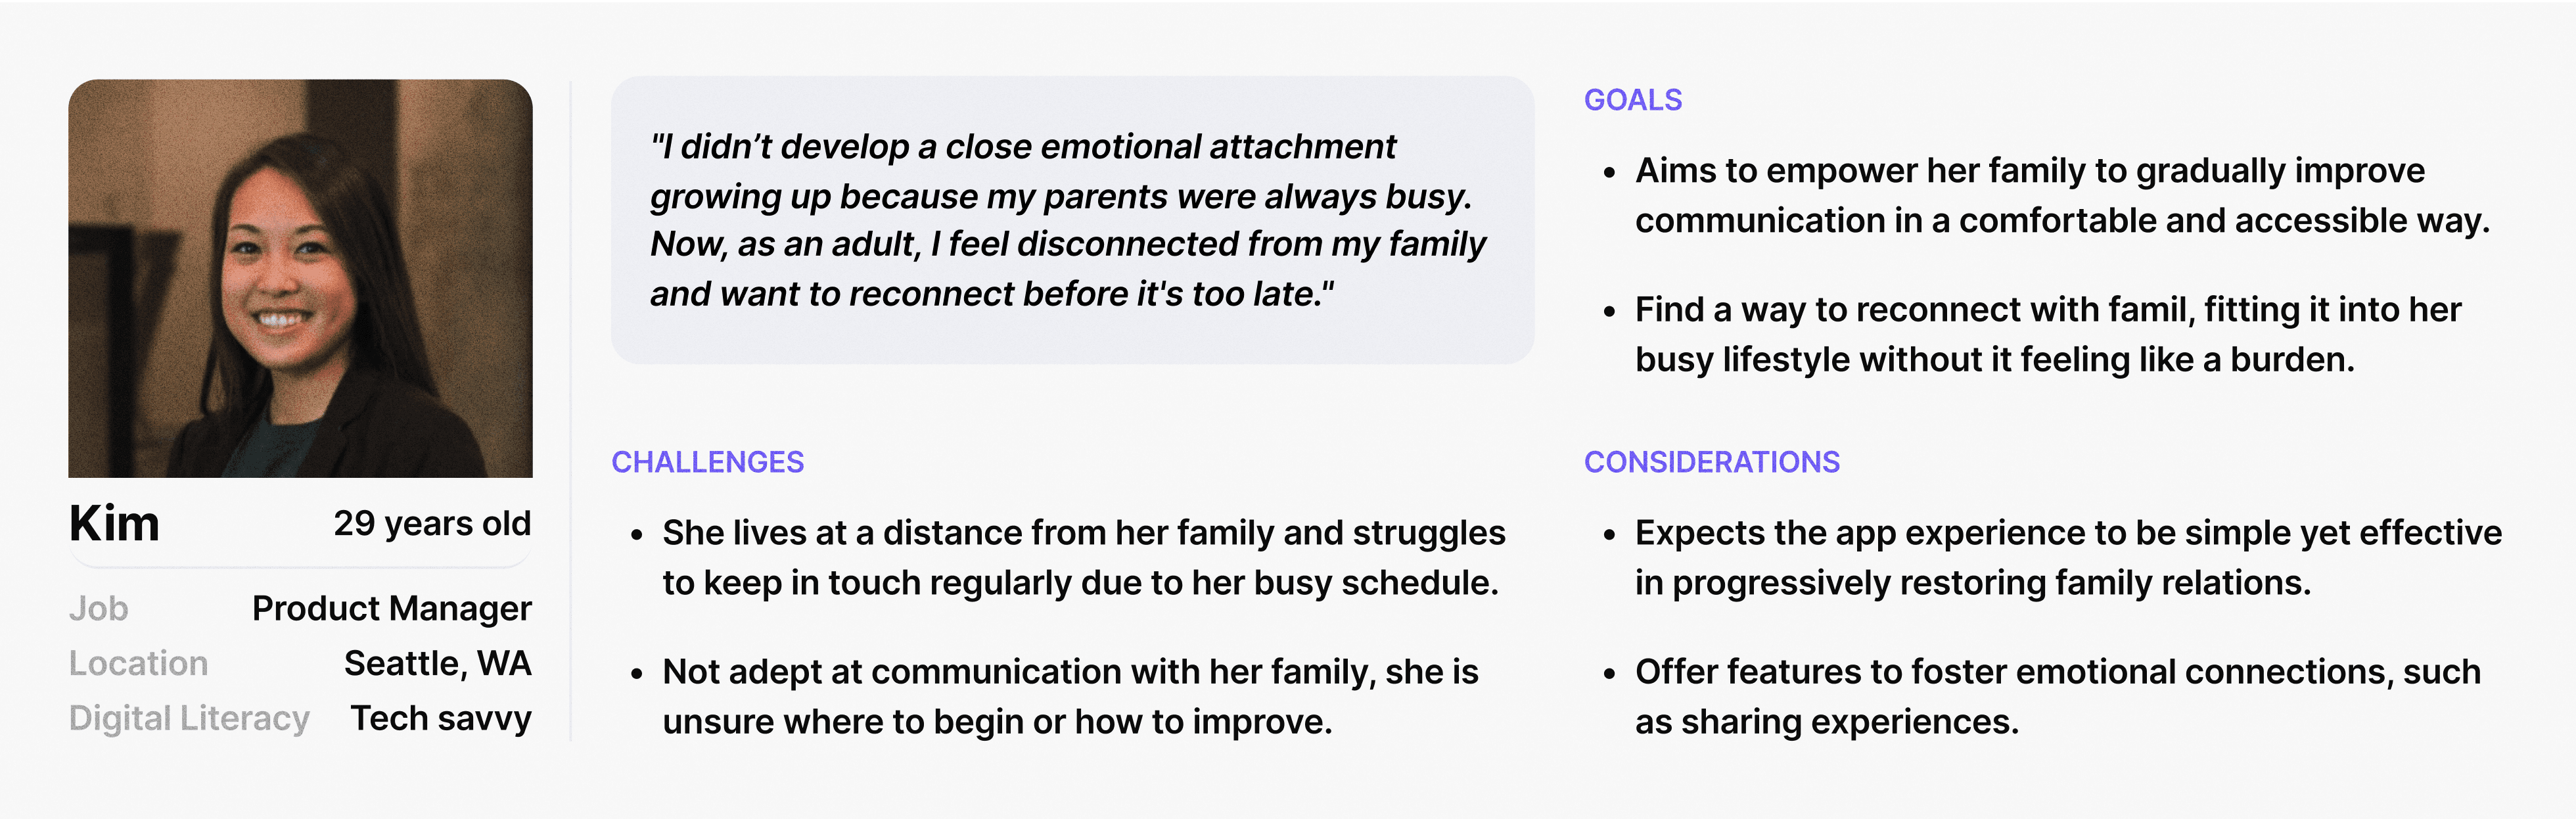
persona
introduce Kim
During the initial research phase, we conducted contextual inquiries and task analysis through Zoom interviews with 9 police officers, crime analysts, and detectives in Massachusetts to investigate the problem.
User Research Analysis
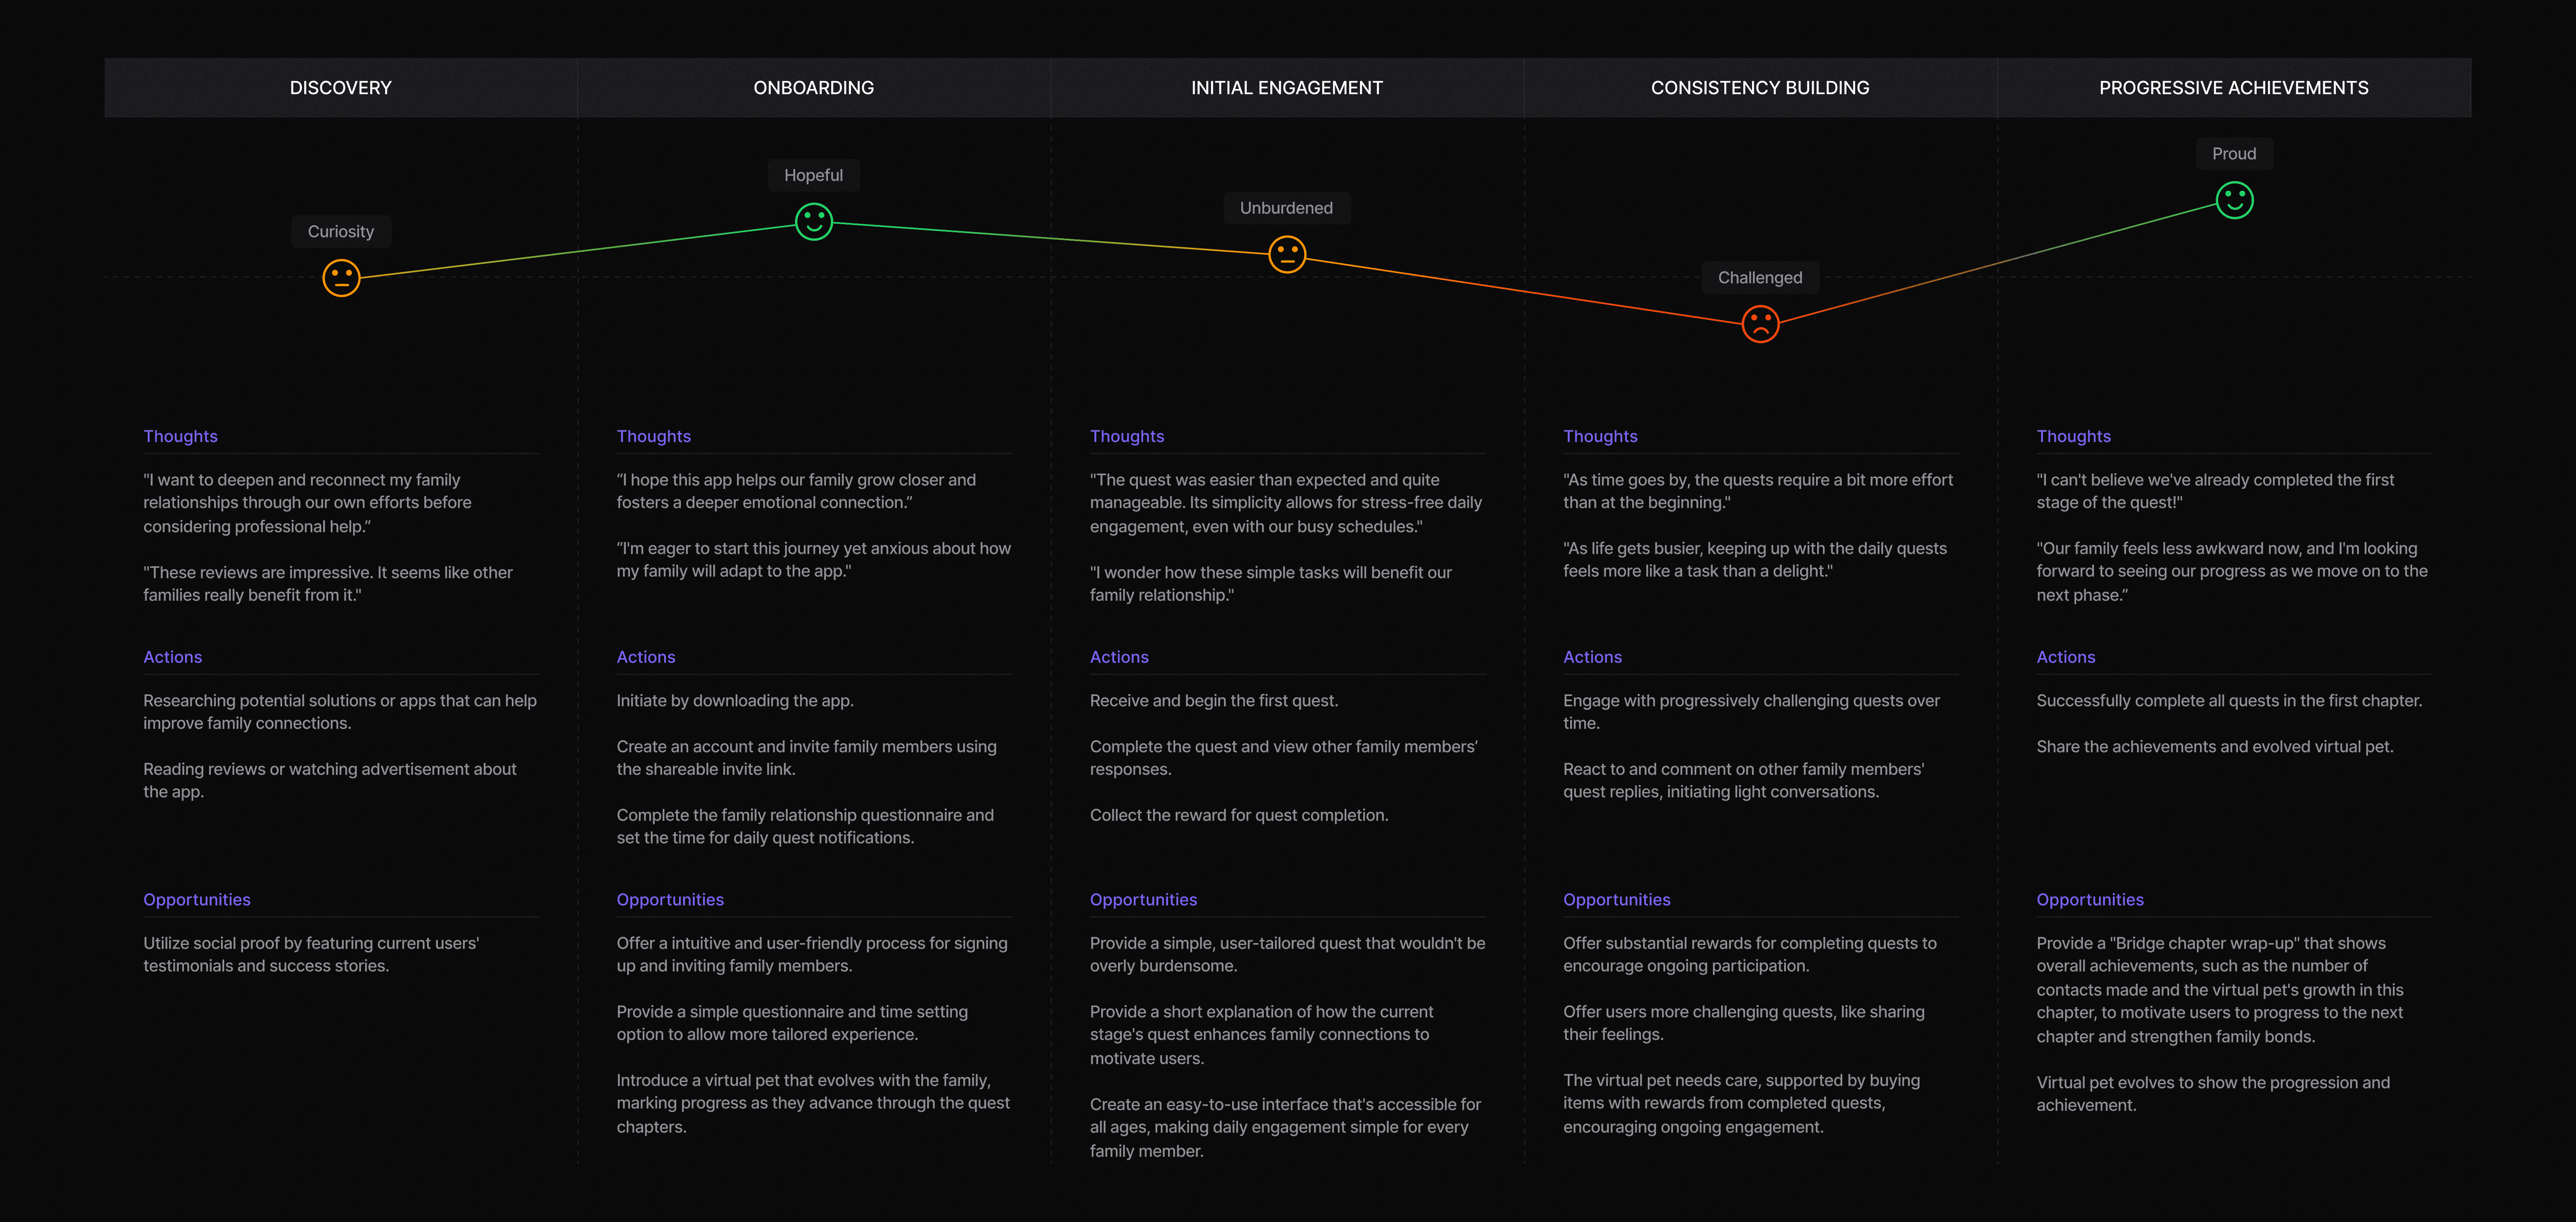
User journey map
In order to extract the user research insights, our team conducted open coding to recognize patterns and themes from the user interview. And we created an affinity diagram to categorize themes to translate into actionable UX design items.
User Research Analysis
User journey map
In order to extract the user research insights, our team conducted open coding to recognize patterns and themes from the user interview. And we created an affinity diagram to categorize themes to translate into actionable UX design items.
User Research Analysis
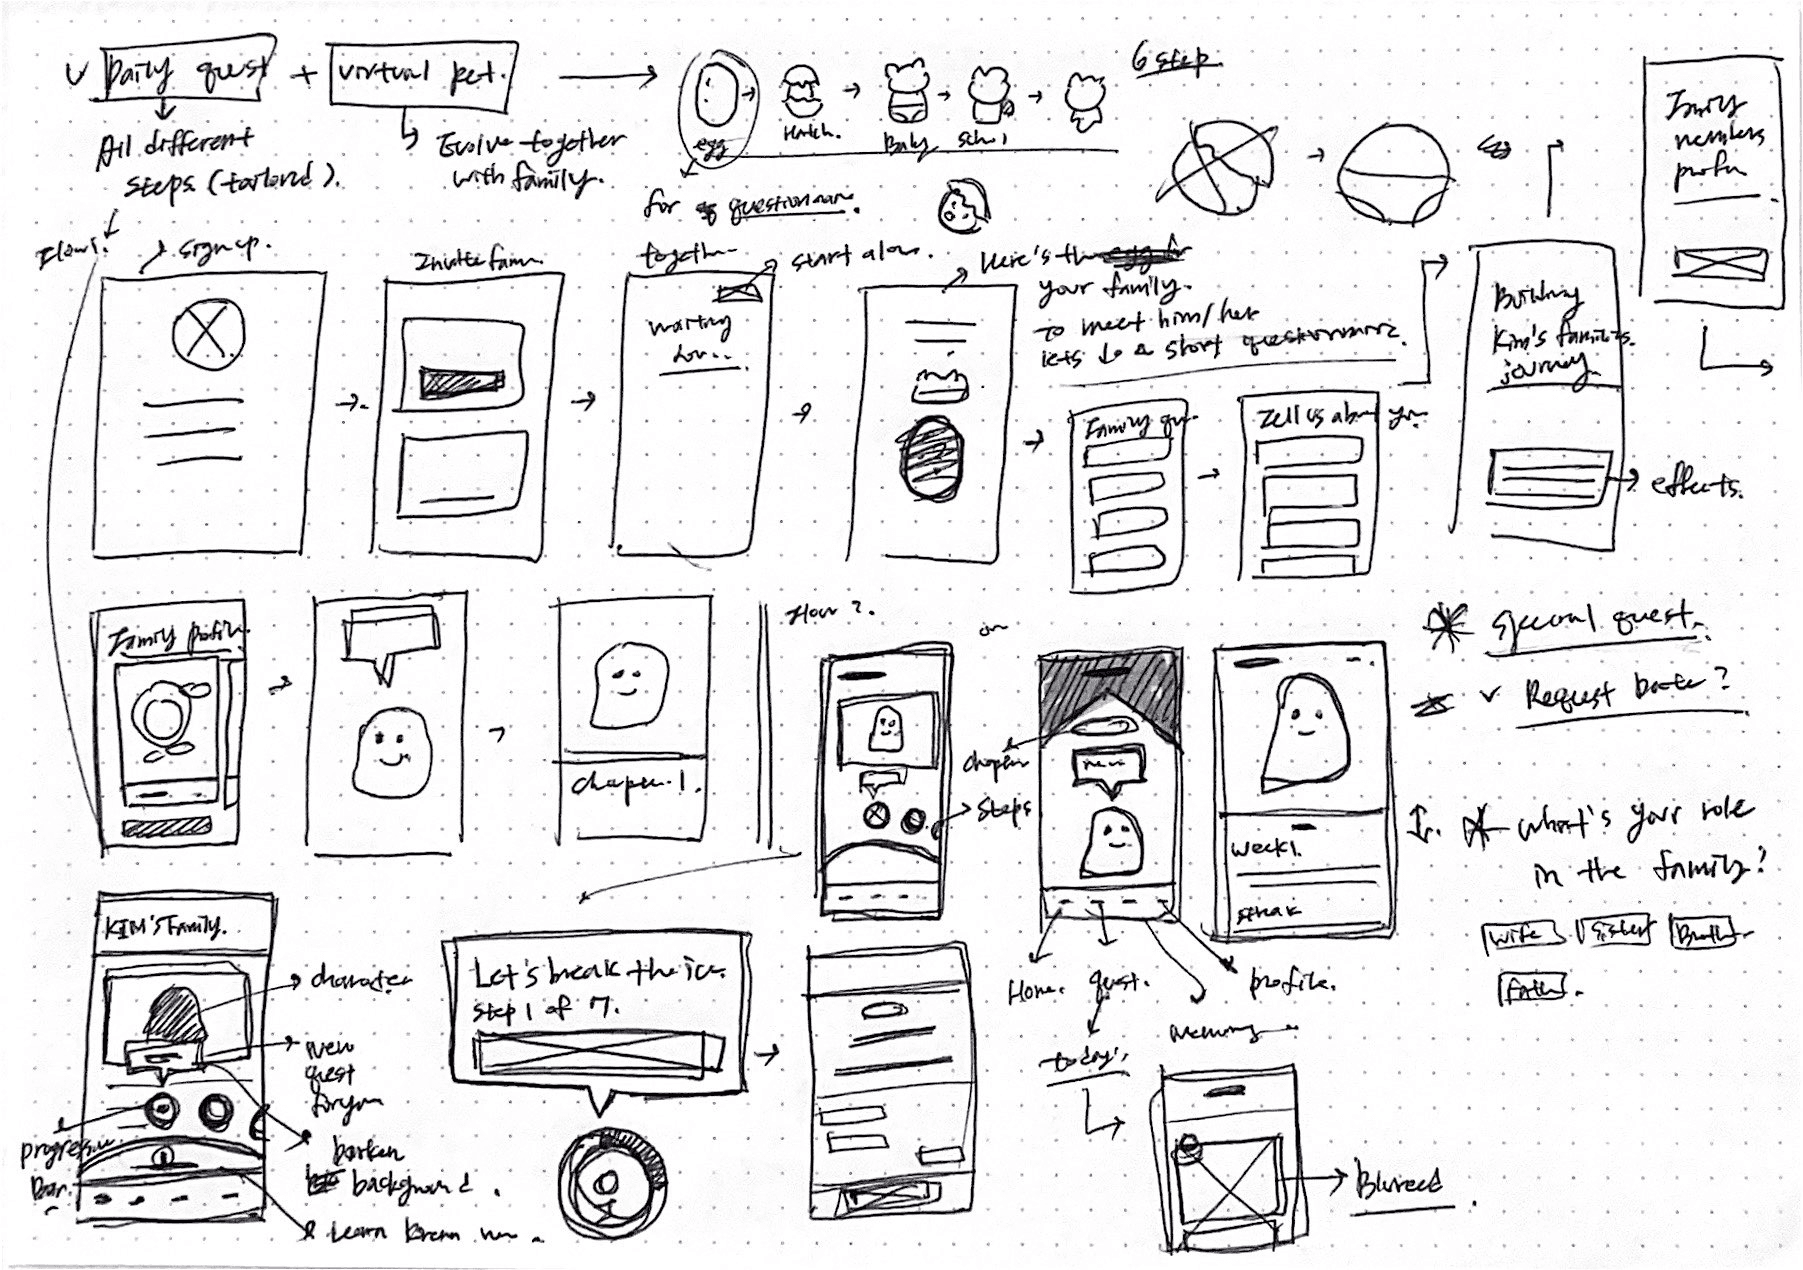
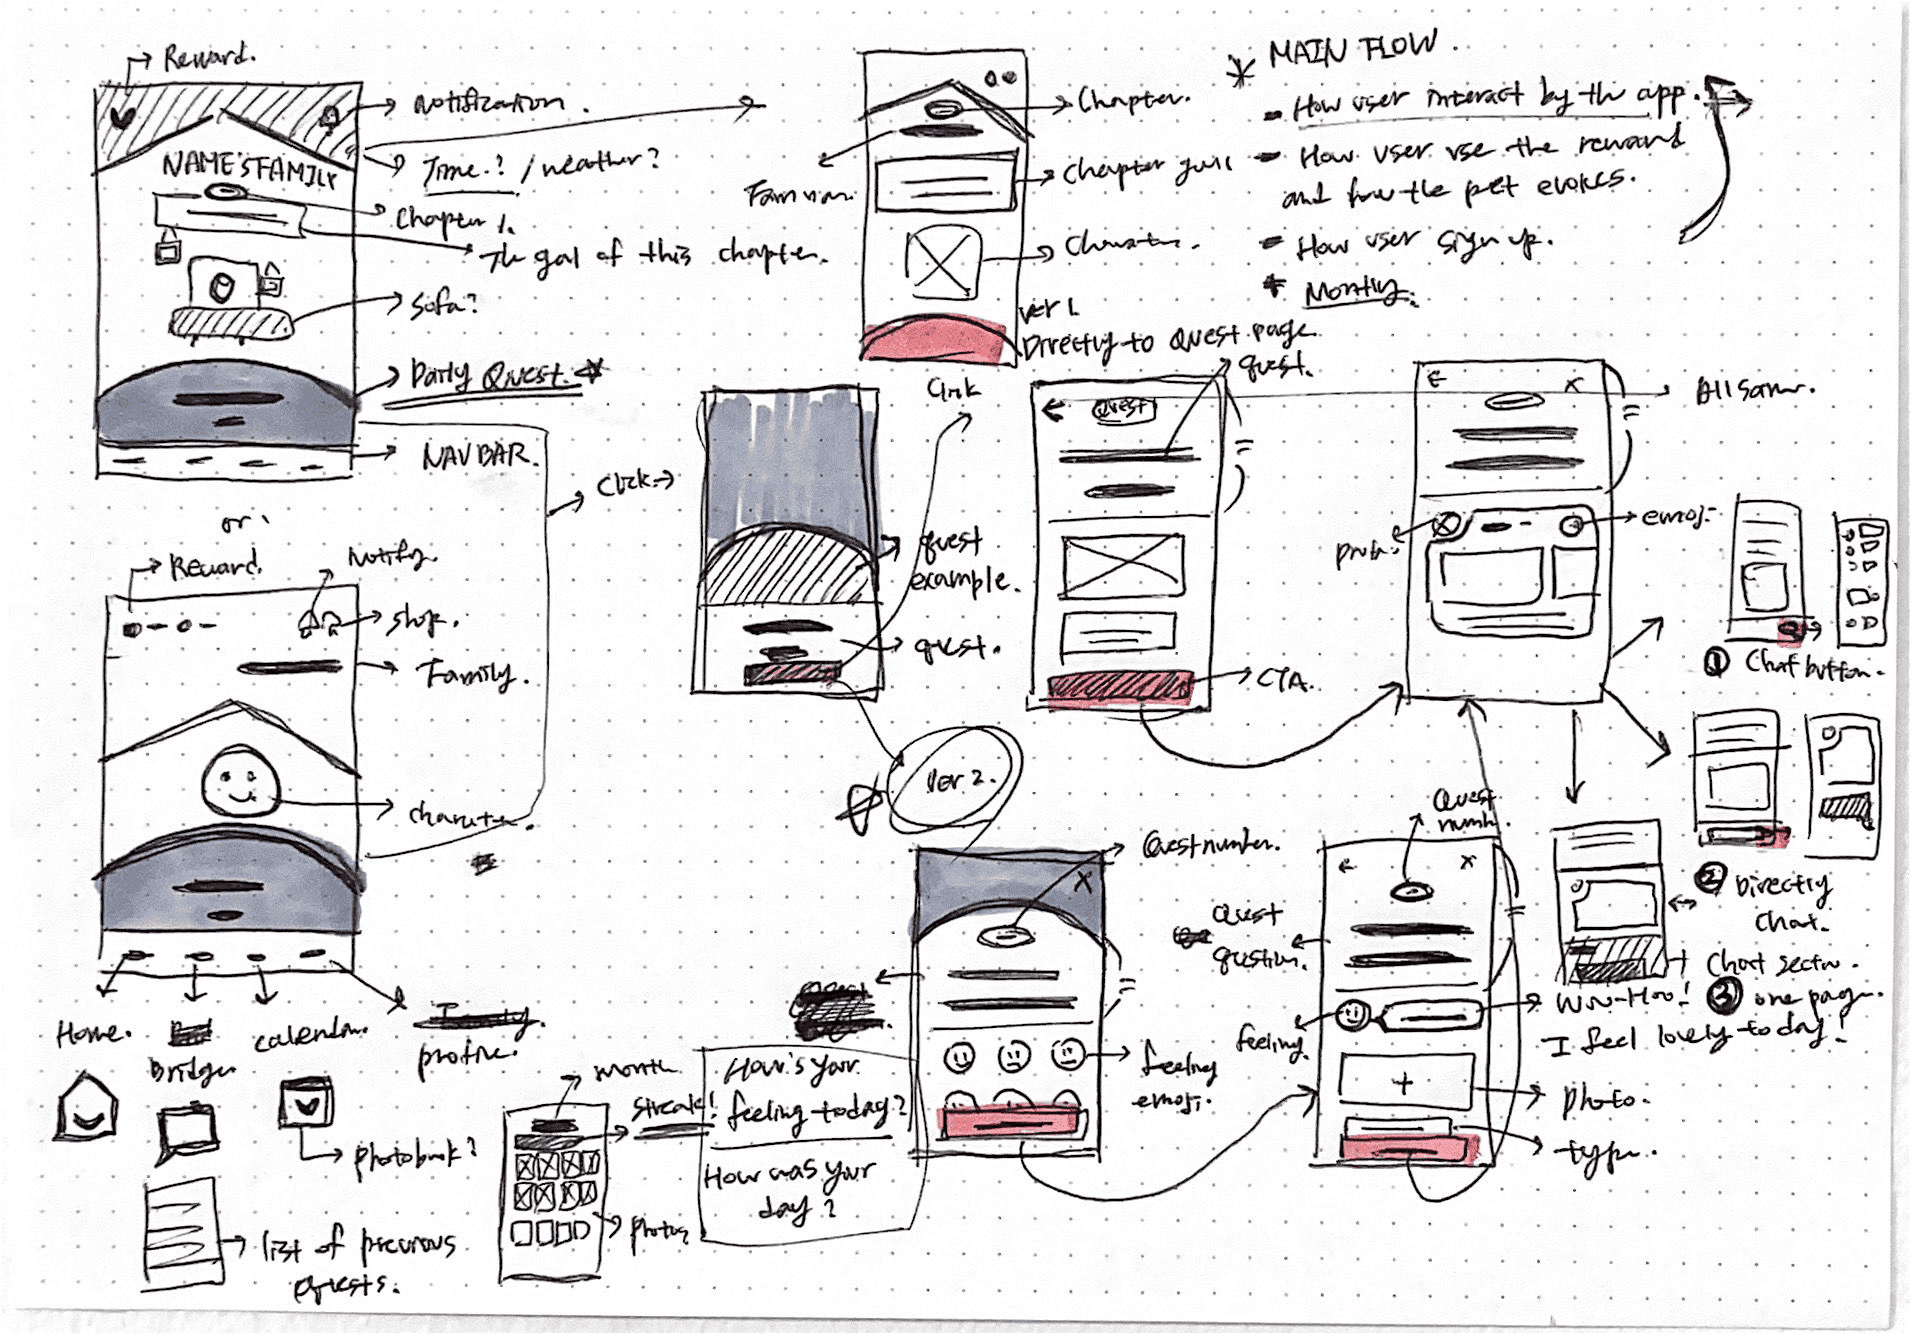
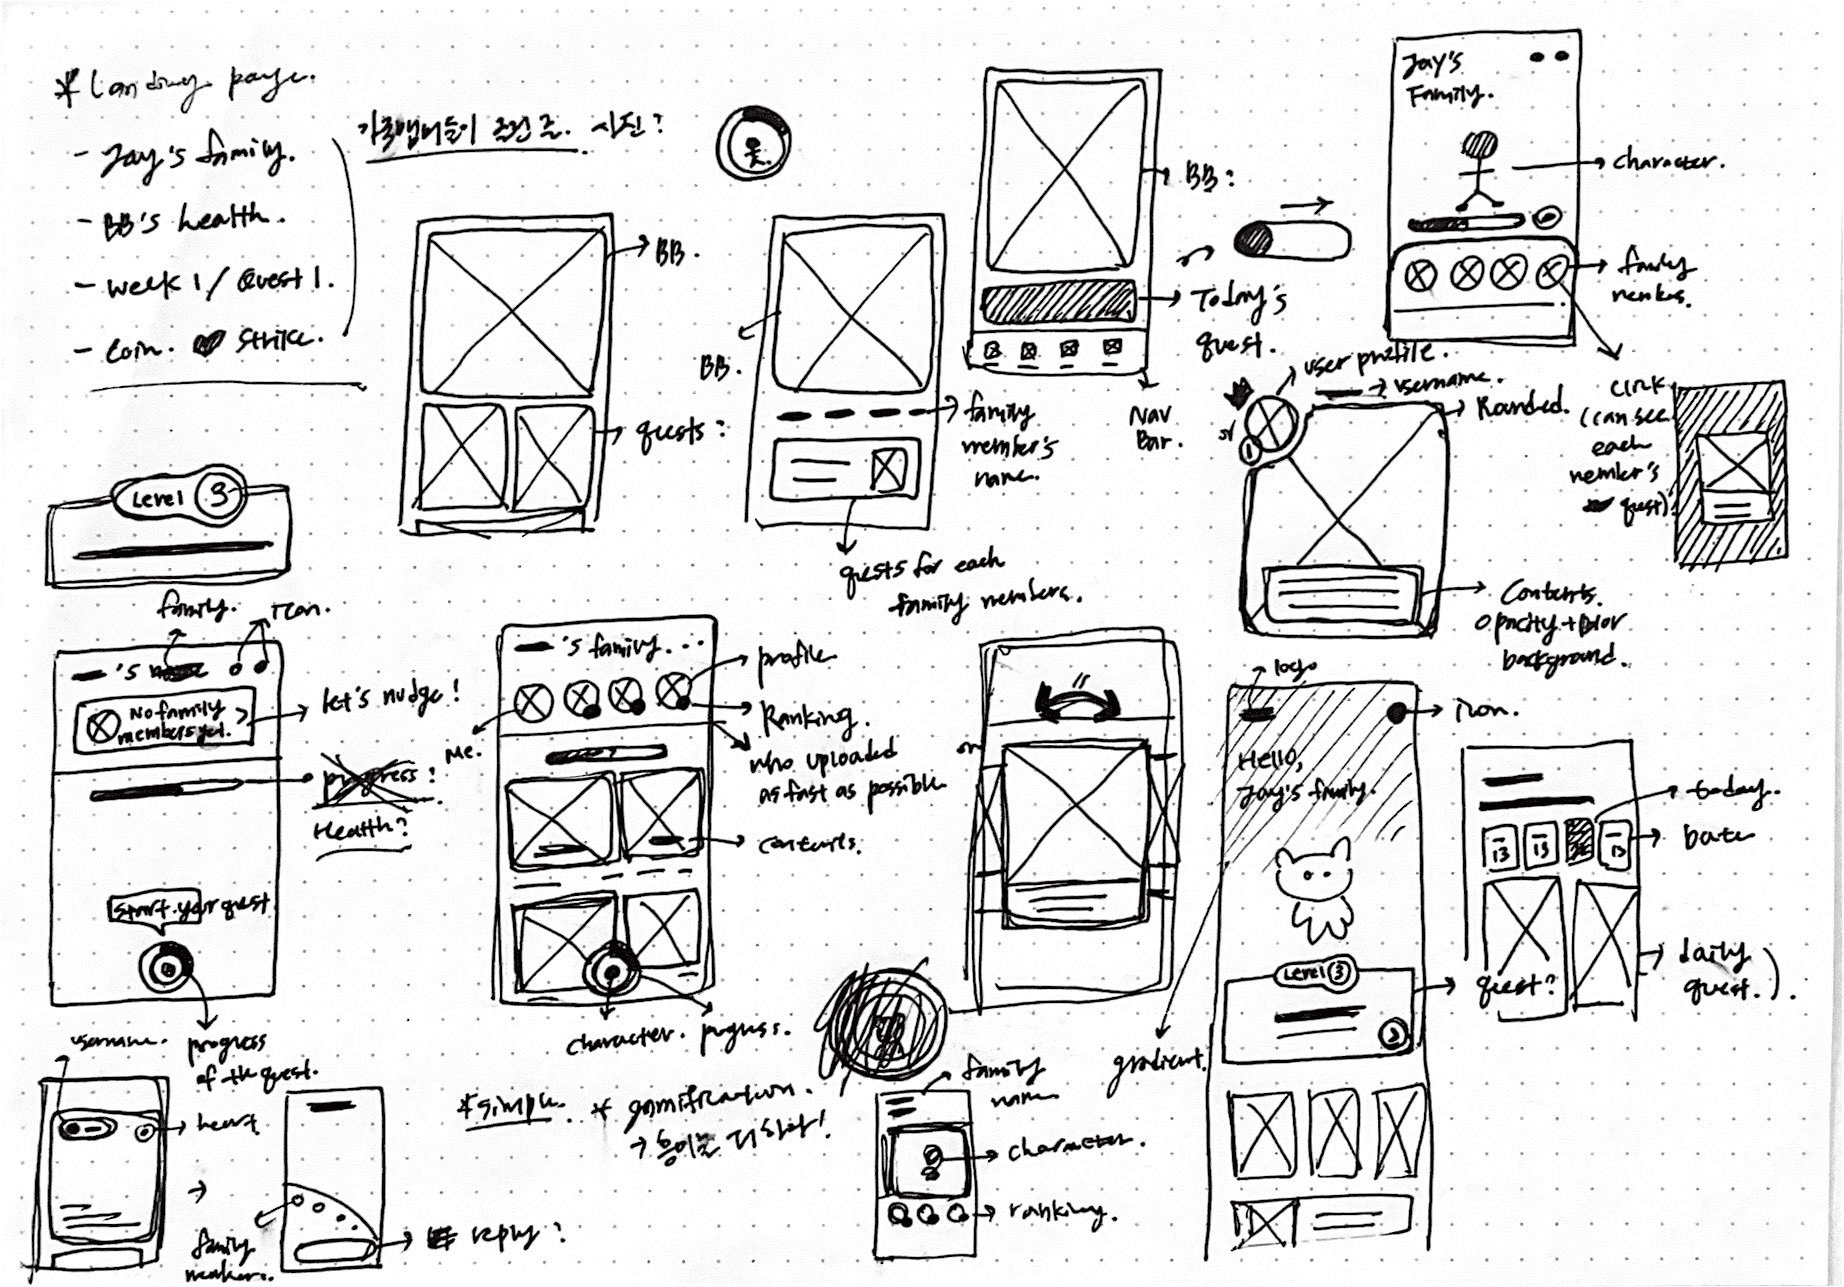
Sketches
We started by identifying key user challenges when interacting with crime data systems. Through user interviews, we learned that users felt overwhelmed by complex data entry requirements and were concerned about losing crucial information in communication overloads.

User Research Analysis
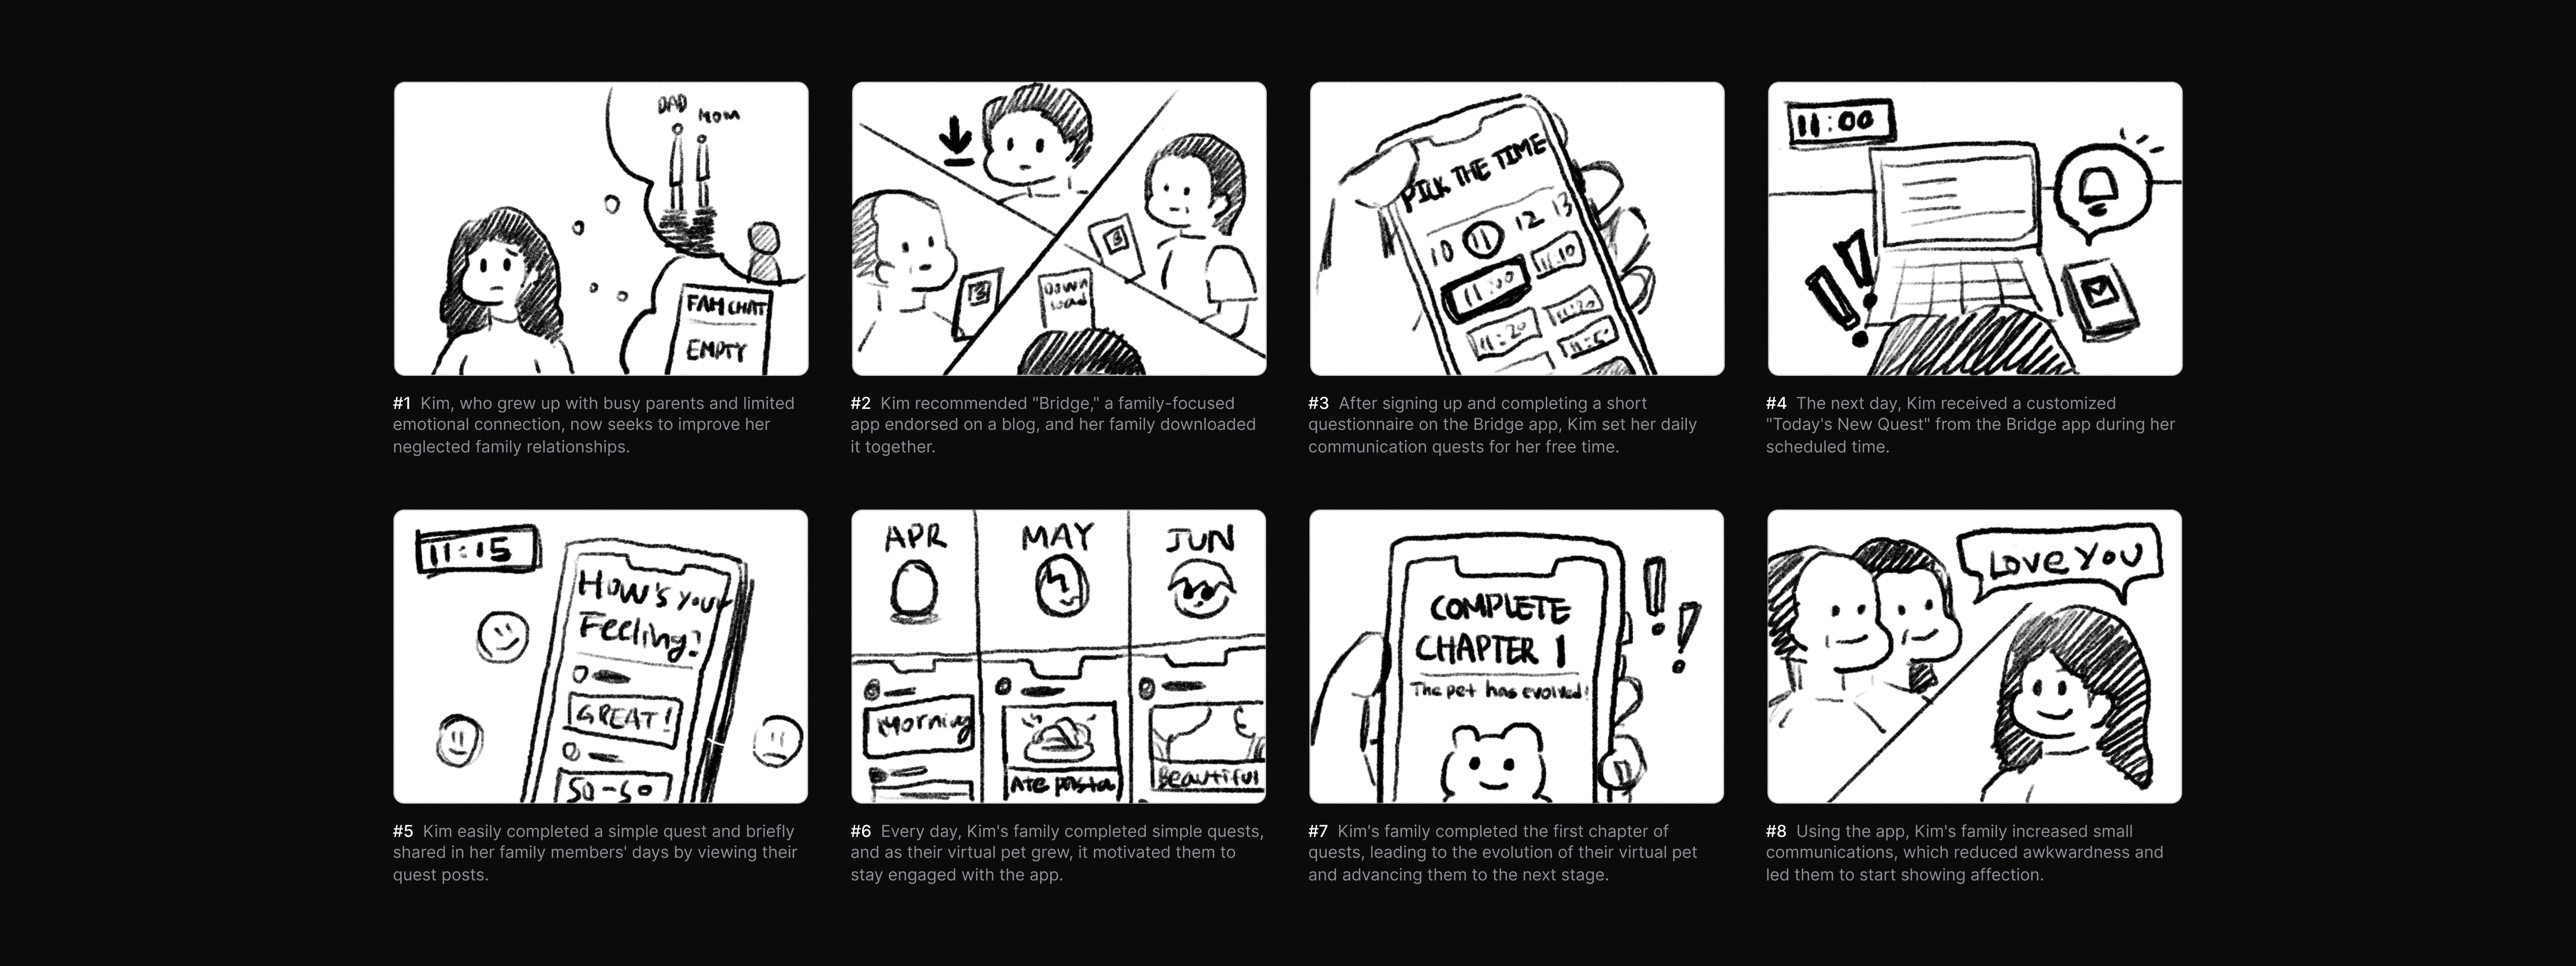
Storyboard
In order to extract the user research insights, our team conducted open coding to recognize patterns and themes from the user interview. And we created an affinity diagram to categorize themes to translate into actionable UX design items.
User Research Analysis
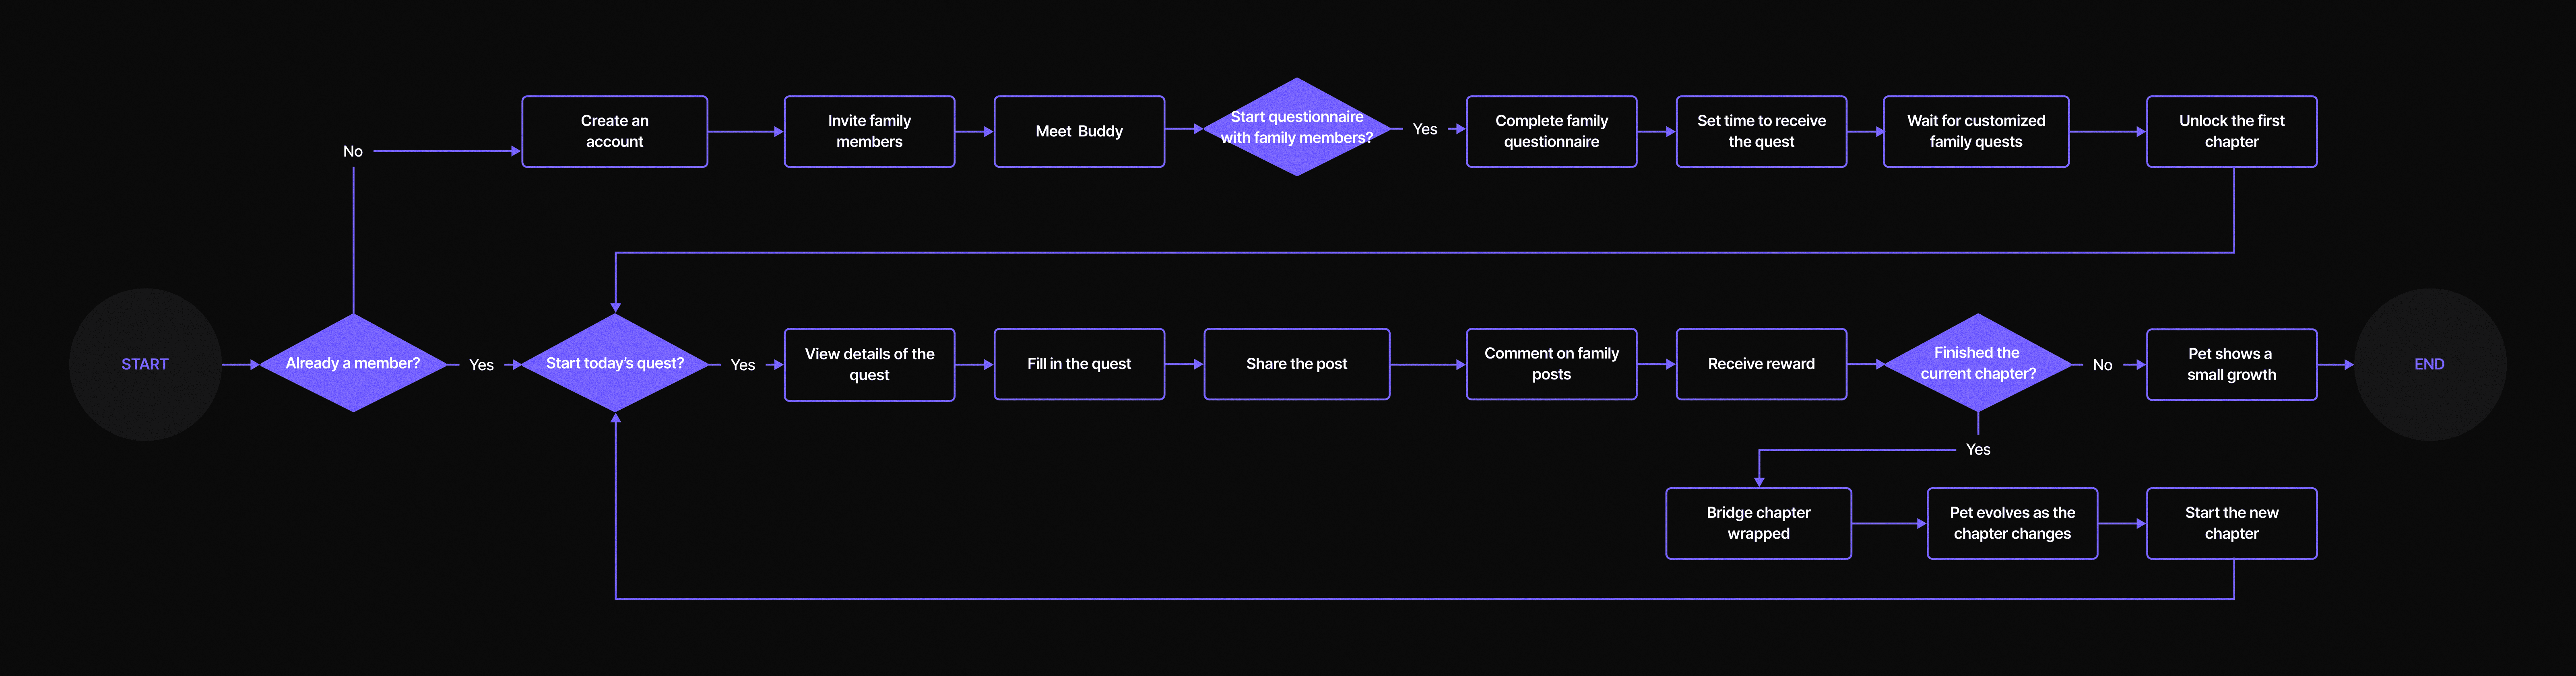
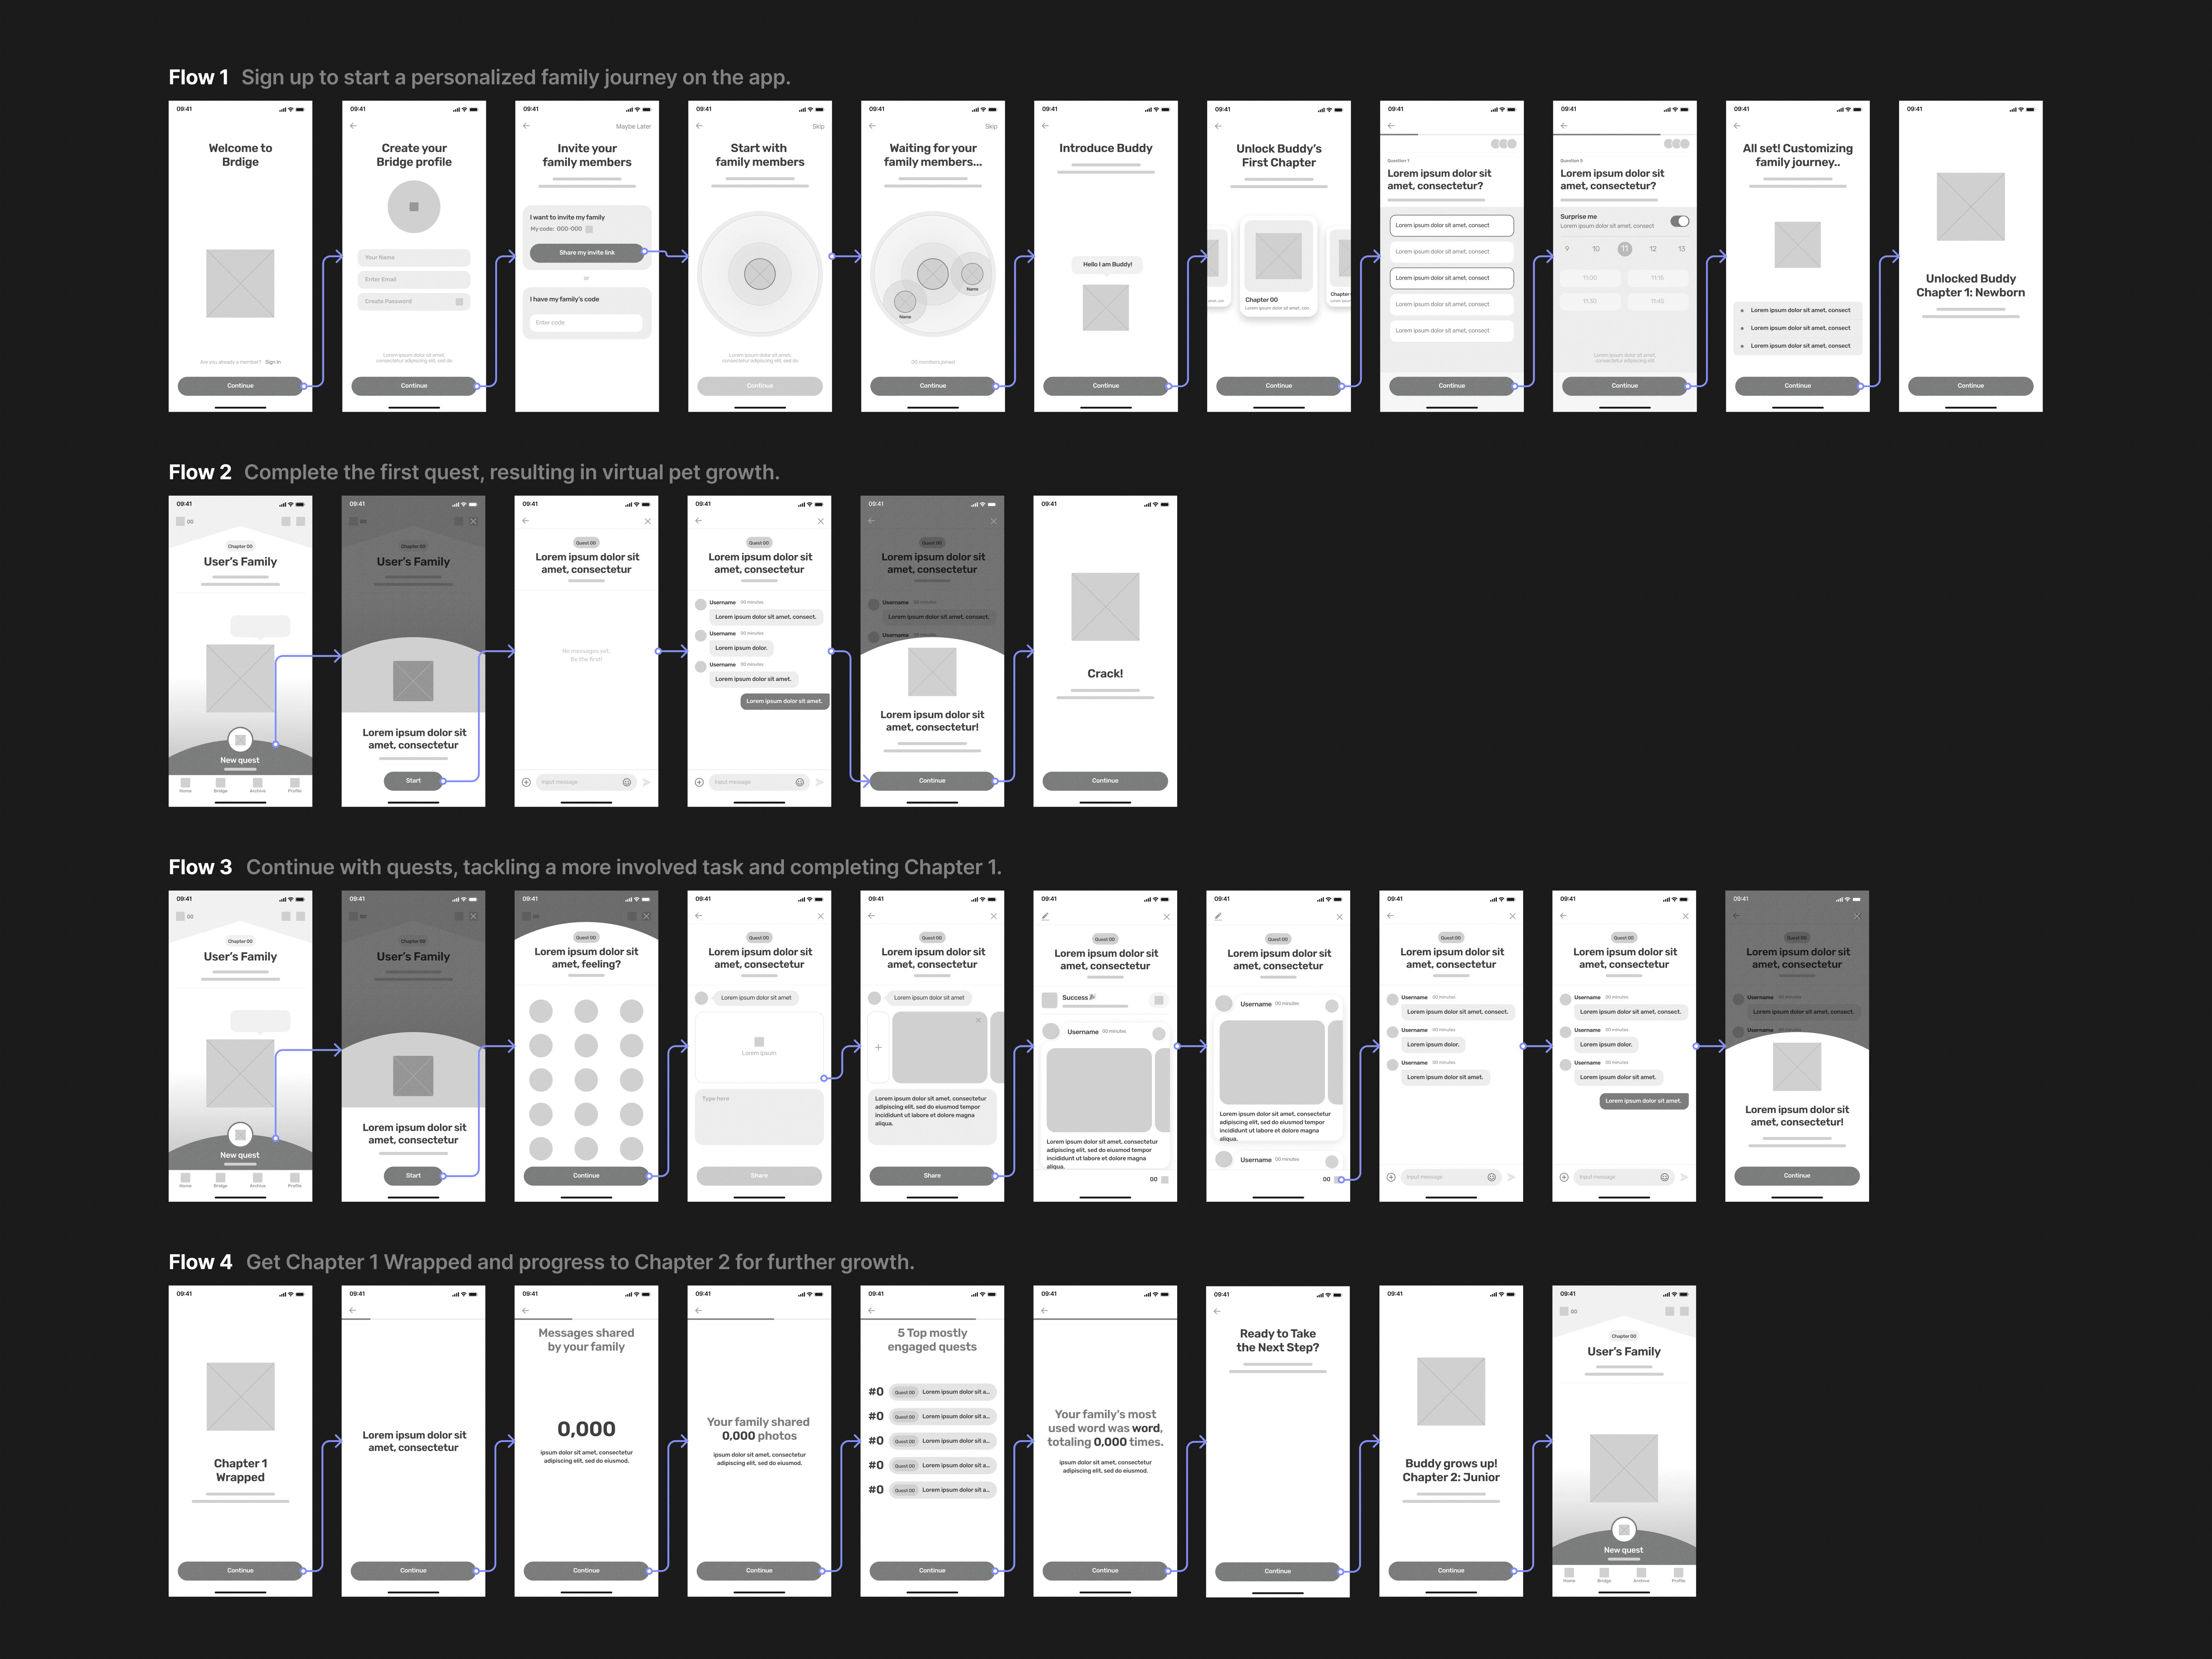
Mid-fi wireflow
In order to extract the user research insights, our team conducted open coding to recognize patterns and themes from the user interview. And we created an affinity diagram to categorize themes to translate into actionable UX design items.
02
Solution.
How did we identify actionable user pain points from our research insights?
Iteration 1
Usability testing and feedback
In order to extract the user research insights, our team conducted open coding to recognize patterns and themes from the user interview. And we created an affinity diagram to categorize themes to translate into actionable UX design items.
Iteration 1
Iteration 1
In order to extract the user research insights, our team conducted open coding to recognize patterns and themes from the user interview. And we created an affinity diagram to categorize themes to translate into actionable UX design items.
iteration 2
Iteration 2
In order to extract the user research insights, our team conducted open coding to recognize patterns and themes from the user interview. And we created an affinity diagram to categorize themes to translate into actionable UX design items.
iteration 3
Iteration 3
In order to extract the user research insights, our team conducted open coding to recognize patterns and themes from the user interview. And we created an affinity diagram to categorize themes to translate into actionable UX design items.
User Research Analysis
Design system
We started by identifying key user challenges when interacting with crime data systems. Through user interviews, we learned that users felt overwhelmed by complex data entry requirements and were concerned about losing crucial information in communication overloads.

